

How to Price Your Home Competitively: Data-Driven Strategy

Pricing your home is one of the most consequential decisions you'll make as a seller — and one of the hardest. You've got memories in those walls, money invested in that kitchen renovation, and very real financial needs tied to the outcome. That emotional weight is completely understandable. But here's the thing: the market doesn't negotiate with sentiment. Buyers in 2026 are informed. They're comparison-shopping across dozens of listings on their phones and quick to move on when a price feels off. The sellers who win — who close quickly and walk away with the strongest possible proceeds — are the ones who price a home competitively using real data, not gut feeling or hope. What does that actually look like? This guide walks you through exactly how to do it, from pulling comparable sales to choosing the right pricing strategy for your specific market conditions, timeline, and property type.

Understanding Competitive Home Pricing in 2026
Why Pricing Matters More Than Almost Anything Else
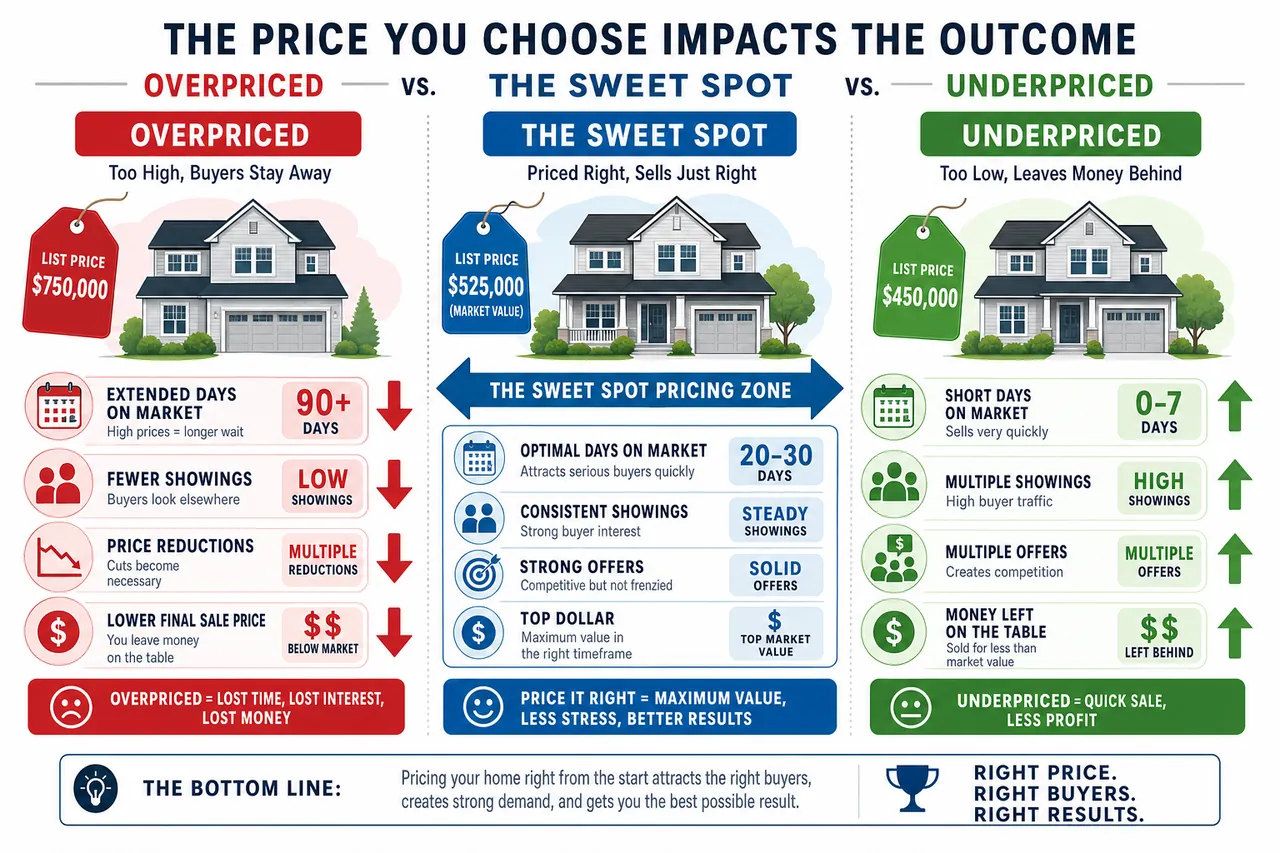
Stage beautifully. Photograph like a pro. Market everywhere. But get the price wrong? None of it matters. Your price is the first filter. It's what determines which search results show your home, which buyers click through to schedule a showing, and whether they arrive ready to make an offer or already skeptical. When you price right, you create momentum. When you overprice? You create doubt. And doubt kills deals.
The numbers prove it. According to Redfin data from June 2026, homes are selling for about 98.4% of their list price nationwide — that's a 1.6% gap that doesn't sound like much until you do the math. On a $400,000 home, you're leaving $6,400 on the table. Often, that happens because sellers start too high, chase the market down, and lose all their negotiating power in the process. The flip side? 24.1% of homes sold above list price in June 2026. That tells you something important: correctly priced homes still generate real competition, even in today's more balanced environment.
The Real Cost of Overpricing vs. Underpricing
Overpricing is the mistake most sellers make, and it snowballs. Your home sits. Buyers and agents start whispering: what's wrong with it? The listing goes stale. After 30, 60, maybe 90 days without an offer, you've handed all the negotiating leverage to the next buyer who does show up. Any offer you get will be substantially lower than what you could have commanded with the right initial price. Then you're stuck. Reduce the price publicly and look desperate? Or hold tight and wait longer?
This isn't hypothetical. June 2026 Redfin data shows 18.9% of listed homes had a price reduction. That's nearly one in five sellers dealing with this exact nightmare. And they're not all foreclosures or problem properties — they're ordinary homes whose owners simply started too optimistic and are now scrambling to catch up with reality.
Underpricing works differently. It's riskier in theory but often smoother in practice. Price your home genuinely below market value, and you might trigger multiple offers and a bidding war that drives the final sale price back up — sometimes higher than you'd have gotten with a standard asking price. But here's the catch: you need confident execution, enough active buyers in your market, and a realistic read on whether your specific property type will actually attract competing bids. We dive into this and five other strategies in detail below.
The 2026 Market Isn't 2021
Don't price your home like it's 2021. That's one of the biggest mistakes you can make right now. Back then, homes routinely sold 10–15% over asking within days. Bidding wars were the norm. That world is gone.
Here's where we are instead. The National Association of Realtors reported a July 2026 median existing-home sale price of $431,400 — up just 1.8% year-over-year as of June 2026. But there's also 4.6 months of inventory supply, which means we're approaching balanced-market territory. And the 30-year fixed mortgage rate as of August 27, 2026, sits at 6.66%, keeping a significant chunk of potential buyers sidelined by affordability pressure.
This market rewards precision, not hope. Sellers who price correctly are moving homes — the median time from listing to contract was 32 days as of April 2026. But sellers who overprice? They're watching their listings collect dust. Which side of that line you end up on starts with mastering comparable sales analysis.
Back to topComparable Sales Analysis: The Foundation of Competitive Pricing
What Are Comparable Sales (Comps)?
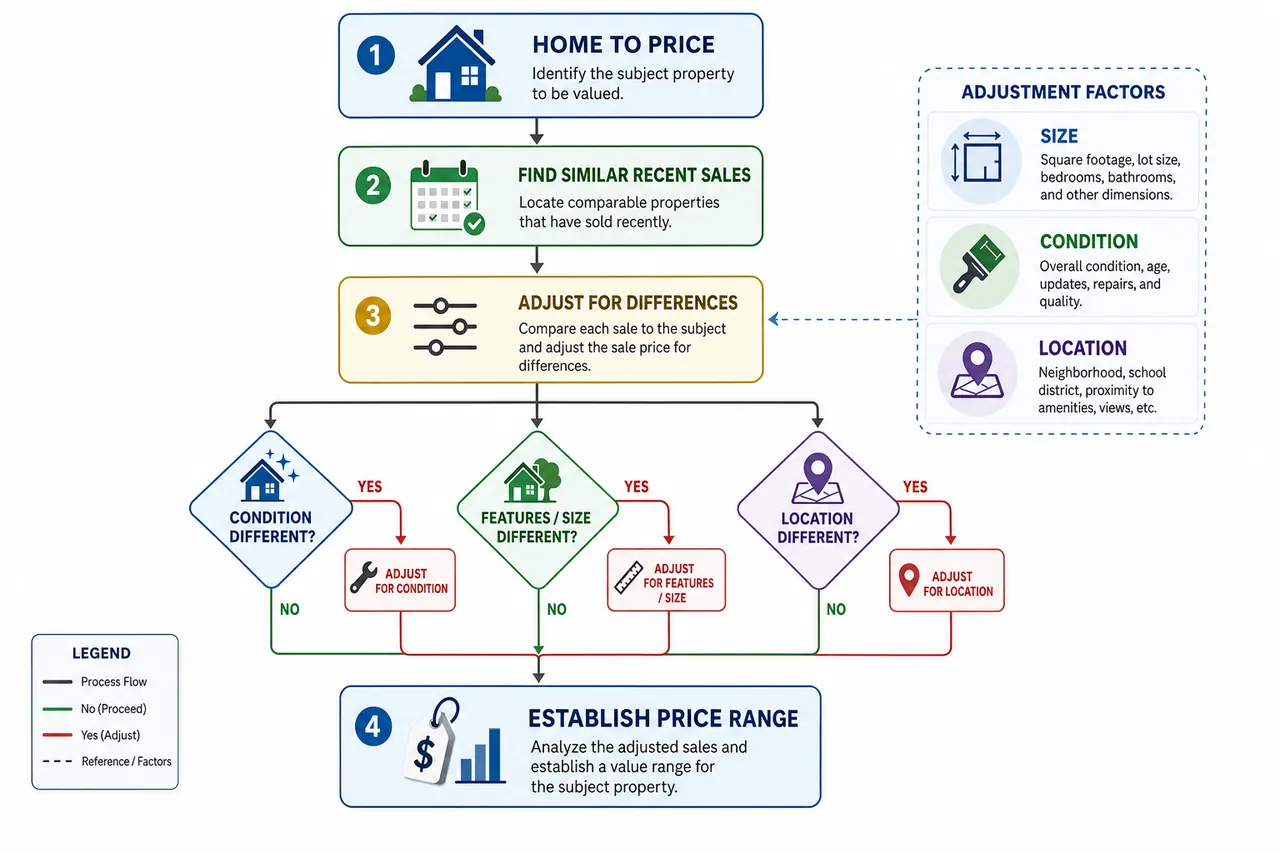
In real estate, we call them "comps" — and they're simply homes like yours that sold recently. Same size, same neighborhood, similar age and condition. What matters most? They show what real buyers actually paid. Not what sellers hoped for. Not guesses. Real market data. Every buyer, agent, and appraiser worth their salt will dig into comps to see if your asking price stacks up. Want the full breakdown? Check out our guide on how to price your home using comps.
How to Find and Evaluate Recent Comps
Your real estate agent has direct access to Multiple Listing Service (MLS) data — that's the gold standard. You can also search Zillow, Redfin, and Realtor.com on your own to see what homes have actually sold for. When you're hunting for comps, use these filters to narrow things down:
- Time window: Look at sales from the last 90 days, or even 60 days if your market moves fast. Anything older than six months? Skip it. Interest rates and seasonal demand shift too much.
- Geographic proximity: Half a mile or less in cities and suburbs. In rural areas, stick to the same school district and neighborhood.
- Size: Stay within 10–15% of your home's square footage. A 1,500-square-foot house shouldn't compare to a 2,200-square-foot house without some heavy adjusting.
- Property type: Single-family to single-family. Condo to condo. Mixing types ruins your numbers.
- Condition: This one's critical. Was the comp move-in ready or a foreclosure mess? A bank-owned sale from a distressed situation doesn't apply to your well-maintained home.
Aim for three to five solid comps. Only finding two? Widen your search area or look a bit further back in time, but understand your price range will have more wiggle room.
Adjusting for Home Features and Condition
Every house is different. So every comp needs tweaking to match your actual property. If you've got a finished basement and the comp doesn't, you add value. If the comp has an extra bathroom you lack, you subtract. It's that straightforward.
Dollar amounts change by market, but appraisers and experienced agents adjust for these categories systematically:
- Gross living area (square footage above grade): Take a comp's sale price, divide it by square footage, and you've got a per-square-foot baseline. Then multiply the difference between your home and that comp by 25–50% of that rate. Why not 100%? Because not every square foot adds the same value.
- Bedroom and bathroom count: Extra bathrooms hit harder in the market. One more bedroom? Less impactful once you've already accounted for square footage.
- Garage: Two-car versus one-car matters in some markets, barely in others.
- Lot size: Suburban and rural buyers care. City buyers? Usually not as much.
- Condition and updates: A brand-new kitchen or bathroom can justify real money above a comp with 1990s finishes.
- Age of major systems: New roof, HVAC, or water heater? Buyers will pay for peace of mind versus a comp with aging systems.
Once you've adjusted all your comps, you'll see a range emerge. That midpoint? It's your anchor for pricing conversations.
Using Comps to Establish a Price Range
Don't rush to pick one magic number. Instead, let comps guide you toward a defensible range — say, $385,000 to $415,000. Where you land inside that range depends on your strategy, how fast you need to sell, and what's happening in your local market right now. A range keeps you honest and grounded in reality, not wishful thinking.
Back to topSix Core Pricing Strategies Explained
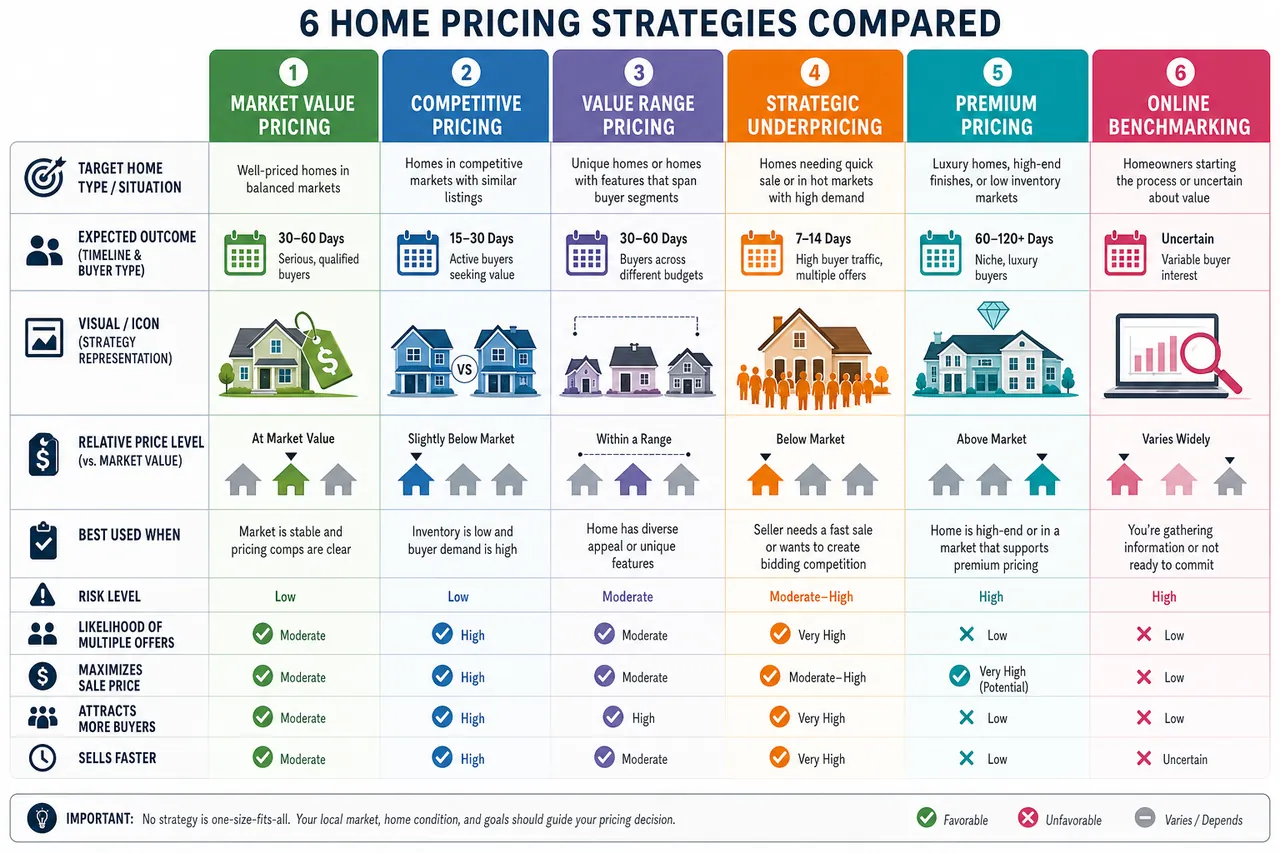
You've got your comp-based price range. Now comes the strategic part: where do you actually list your home? Do you play it safe at market value, undercut the competition, or ask for premium dollars? It depends on what the market's doing right now, how fast you need to sell, whether your property stands out, and your comfort level with risk. For a deeper dive into how these play out in real transactions, check our guide on pricing your home to sell with a market-based strategy.

| Strategy | Best Market Conditions | Key Advantages | Key Disadvantages | Typical Timeline | Price Positioning |
|---|---|---|---|---|---|
| Market Value Pricing | Balanced or moderate seller's market | Attracts qualified buyers; defensible to appraisers | No built-in urgency; slower in flat markets | 30–60 days | At comp midpoint |
| Competitive Pricing | Buyer's market or high inventory | Differentiates from similar listings; drives showings | Leaves potential money on table in strong markets | 15–30 days | Slightly below comp midpoint |
| Value Range Pricing | Balanced markets with diverse buyer pool | Attracts broader range of buyers; reduces anchor effect | Can confuse buyers; less common and agent-dependent | 20–45 days | Range spanning comp midpoint |
| Strategic Underpricing | Seller's market with strong buyer demand | Can trigger bidding war; fastest route to offers | Risky if buyer pool is thin; may end below market | 7–14 days | 5–10% below comps |
| Premium Pricing | Luxury segment; unique or rare properties | Maximum proceeds when home is genuinely differentiated | Smaller buyer pool; longer time on market | 60–120+ days | Above comp ceiling |
| Online Benchmarking / AVM-Anchored | Any market; used as a starting research point | Quick baseline; accessible without agent | Automated estimates can miss condition, upgrades | Varies | Refined from AVM output |
Market Value Pricing: Hitting the Sweet Spot
Most residential homes sell best when priced right at — or within a hair of — what your comps say they're worth. This strategy signals to buyers that you're serious and realistic. It attracts people with actual purchasing power, not just lookers. And you'll get an appraisal that actually supports your sale price. If you're not in a rush and your market's reasonably balanced (which describes much of 2026), this is your default move.
Competitive Pricing: Positioning Against Active Inventory
Too many similar homes for sale in your neighborhood? Price slightly below your comp midpoint. Your goal isn't to hand away money — it's to become the obvious choice when a buyer's comparing three similar listings. Faster offers arrive. You avoid months of carrying costs and the mental strain of watching your listing age. Even a 2–3% cut from comps can push your home from page two of online results to page one where buyers actually look.
Value Range Pricing: Giving Buyers Options
Some markets allow you to list with a range instead of a single price — something like "Offers considered between $380,000 and $420,000." Sounds good in theory: it invites more conversations and doesn't trigger the sticker shock of a hard number. But it can also confuse buyers. And honestly? Most agents outside luxury markets don't do this regularly. Before betting on this approach, ask your agent if it's standard practice where you live.
Strategic Underpricing: The Bidding War Approach
List 5–10% below market value on purpose. The theory: you'll get flooded with showings and multiple offers, which then drives your final price right back up — or even above where you started. This absolutely works in a screaming hot seller's market with plenty of qualified buyers hunting for homes. But it's dangerous if demand is soft. You might end up with one offer and no leverage. Before you go this route, talk honestly with your agent about your neighborhood's absorption rate — how fast homes actually move. Our guide on how to create a bidding war for your home has the full playbook.

Premium Pricing: Positioning Luxury and Unique Homes
Some homes genuinely command premium prices. Stunning views. Architectural significance. A location where comparable sales are nearly nonexistent. Top-tier finishes throughout. If that's your home, pricing above the comp ceiling makes sense. Just know that premium positioning requires serious marketing and a clear story about why your home is worth more. Without that narrative, buyers will simply wait for you to come down.
Psychological Pricing: The Numbers Game
Here's something most sellers overlook: the exact number you choose actually matters. A lot. List at $399,900 and you show up in searches capped at $400,000. Price at $402,000 and you disappear from that entire bracket. Online buyers filter by round numbers — $300K, $350K, $400K — almost universally. Being one thousand dollars too high costs you serious visibility. That's why experienced agents consistently price just below psychological thresholds: $499,000 instead of $500,000; $374,900 instead of $375,000. The visibility difference is real, and it compounds fast when you're trying to generate showings.
Back to topMarket Analysis Tools and Methods
Free Online Home Value Estimates
Zillow (Zestimate), Redfin, and Realtor.com offer a quick snapshot. They're free. But here's the catch: these automated valuation models rely on public records, recent sales data, and algorithms. They can't see your new hardwood floors, your outdated bathrooms, the noisy highway behind your fence line, or whether your neighbor's house sold because they were desperate to move. What if that comparable sale that influenced your estimate was a motivated seller situation? It was, and the algorithm doesn't know. Use online estimates to get oriented—think of them as a ballpark figure. Then dig deeper with actual comp analysis and someone who actually knows your neighborhood.
| Tool | Cost | Data Source | Accuracy Level | Best Use Case | Limitations |
|---|---|---|---|---|---|
| Zillow Zestimate | Free | Public records, MLS feeds, user data | Moderate (varies widely by market) | Initial orientation and ballpark | Can't assess condition, upgrades, or anomalies |
| Redfin Estimate | Free | MLS data, public records | Moderate to good in MLS-heavy markets | Cross-check against Zillow | Less reliable in rural or thin-data markets |
| Realtor.com Estimate | Free | MLS and public records | Moderate | Third data point for triangulation | Similar AVM limitations as above |
| Agent CMA | Free (typically) | Full MLS access, local knowledge | High | Primary pricing analysis for most sellers | Quality varies by agent experience |
| Professional Appraisal | $300–$600+ (paid) | On-site inspection + MLS + public records | Highest | Unique homes, estate sales, disputes, pre-listing | Cost; reflects value at one point in time |
| AI-Assisted Analysis | Free to low cost | Depends on tool and data inputs | Varies widely | Augmenting research and marketing strategy | Not a substitute for local market expertise |
Professional Appraisals vs. Estimates
A licensed appraiser walks through your home in person. They inspect everything, adjust comparable sales using professional methodology, and hand you a credible value opinion that lenders will actually accept. For most sellers, a pre-listing appraisal isn't required—a solid agent CMA gets the job done. But if your home's unusual, high-value, part of an estate, or you and your agent are way off on price, an appraisal is worth the money. You'll spend $300 to $600-plus, and you'll get something neither you nor your agent can provide on your own: an objective third-party anchor. And you can share it with buyers to back up your asking price.
The Real Estate Pricing Pyramid
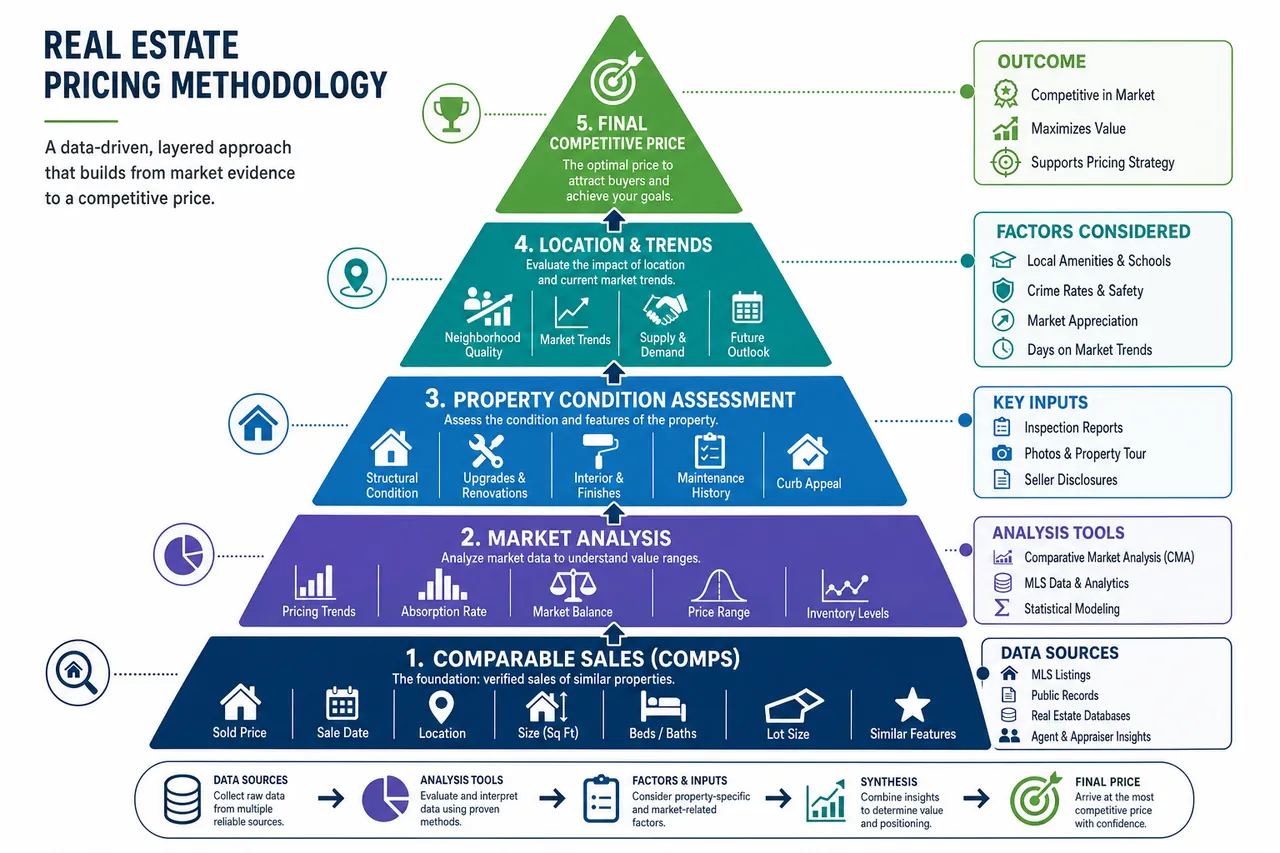
Think of pricing accuracy like a pyramid. Broadest at the base? Online AVM estimates—least precise. The middle layer holds the agent-prepared Comparative Market Analysis, which adds local knowledge and complete MLS access. At the peak—most precise, most expensive—sits the professional appraisal. Most sellers find their sweet spot in the middle tier. Get a quality CMA from an experienced local agent, check it against those AVM numbers, and you've got your answer.
Comparative Market Analysis (CMA)
Your real estate agent's CMA is your workhorse. It's the most practical primary pricing tool for most home sellers. A thorough CMA looks at three categories. First: recently sold comparable homes—actual prices buyers have paid. Second: active listings—the homes you're competing against right now. Third: expired or withdrawn listings—homes that didn't sell, telling you which prices the market rejected. These three layers together show you exactly where to price your home to attract buyers, beat the competition, and avoid becoming a cautionary tale of a listing that went stale. For detailed guidance specific to your state, check out our pricing guides for California, Florida, Colorado, Washington, Tennessee, and Indiana.
Cash Buyer Perspective Analysis
Maybe you're thinking about a cash offer. An investor, iBuyer, or direct buying company might approach you—and understanding how they price things is revealing, even if you end up selling on the open market. Cash buyers use a simple math formula. They calculate after-repair value (what your home would be worth fully fixed and updated), subtract their repair costs, subtract their required profit margin. What's left is their offer. This calculation cuts through the noise fast. It shows you exactly how much gap exists between what the market will actually support and what you can realistically pocket. It's especially valuable when you're dealing with major repairs or structural problems. Trying to decide between a cash offer and a traditional listing? Our guide on how to choose the best offer for your house walks you through the trade-offs.
Back to topFactors That Impact Competitive Pricing
Home Condition and Needed Repairs
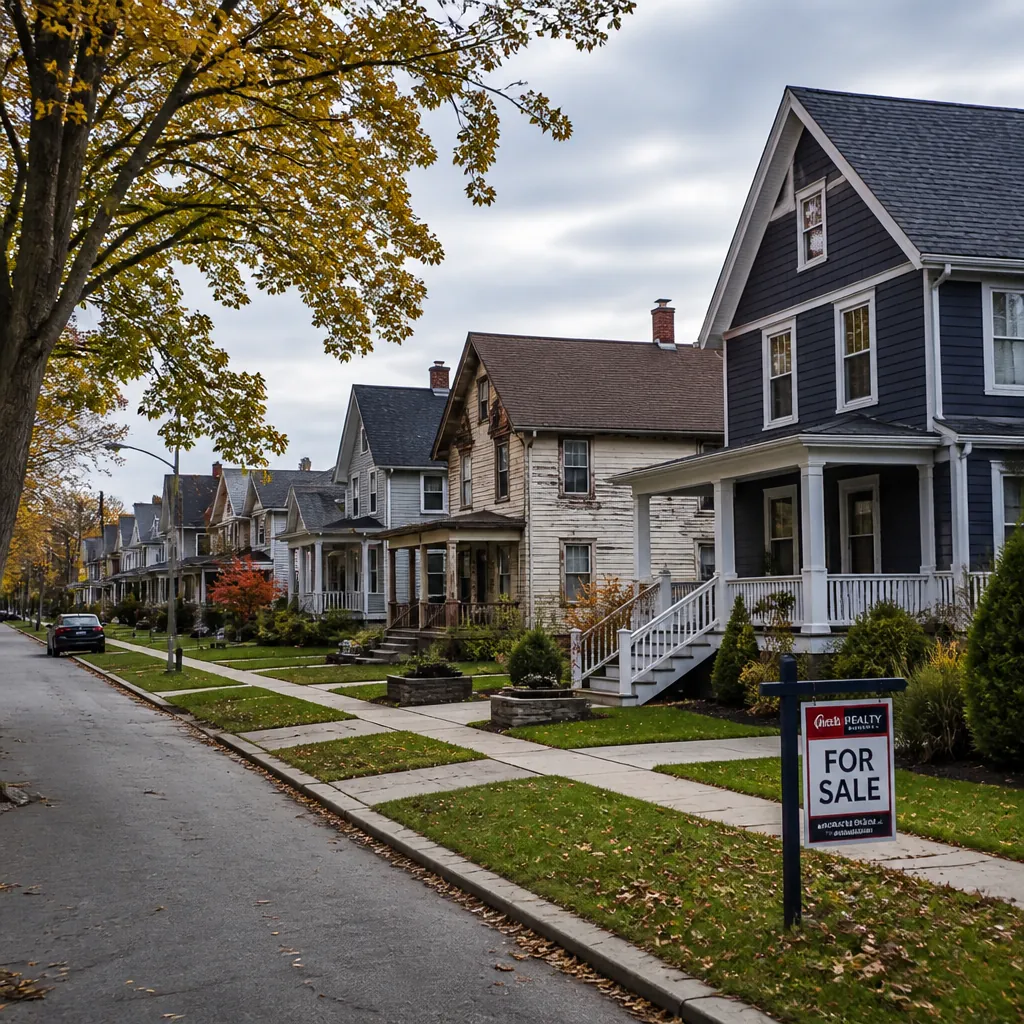
Home condition is one of the most powerful — and most commonly misjudged — variables in pricing. Here's what happens: sellers underestimate how visible deferred maintenance is to buyers, and how deeply buyers discount for uncertainty. That roof with five years of useful life left? Its age and wear will cost you far more in buyer negotiation than it would've cost to replace before listing. Same story with outdated HVAC systems, water-stained ceilings, cracked foundations, and aging electrical panels.
You've got two honest choices. Fix condition issues before listing and price at market value. Or disclose them, price at a discount that reflects actual remediation costs, and attract buyers ready to do a project. What doesn't work? Ignoring a condition issue and pricing as if it's not there.
Buyers will find it during inspection. Then you'll either renegotiate when you're weakest or lose the deal entirely.
Location and Neighborhood Trends
Location goes way beyond the old "location, location, location" saying. Proximity to good schools, walkability scores, commute access, nearby commercial development, and neighborhood trajectory (improving or declining) all shape what buyers will pay. And here's the piece most sellers miss: developments planned or underway near your home. Both the good ones — new transit line, park redevelopment — and the bad ones — large commercial construction, zoning changes that don't help you. Buyers researching your neighborhood will find these. Your price should reflect the full picture.
Seasonal Market Timing
Real estate markets move with the seasons. Understanding where you fall in that cycle helps you set realistic expectations and calibrate strategy accordingly.
| Season | Typical Market Conditions | Buyer Behavior | Recommended Pricing Approach | Strategic Notes |
|---|---|---|---|---|
| Spring (Mar–May) | Peak demand; highest inventory and buyer activity | Motivated, move-up buyers; families before school year | Price at or slightly above market value | Best window for maximum proceeds in most markets |
| Summer (Jun–Aug) | Strong, especially early; slows mid-August | Continued family buyers; investor activity | Market value pricing; watch for August slowdown | Competitive for move-in-ready homes near good schools |
| Fall (Sep–Nov) | Moderate; serious buyers remain | Motivated buyers with year-end deadlines | Competitive pricing to differentiate from remaining inventory | Less competition from other sellers; focused buyer pool |
| Winter (Dec–Feb) | Slowest period; lowest inventory and buyer volume | Serious, often relocating buyers; less casual browsing | Competitive or below-market pricing to compensate for thin pool | Less competition; buyers who appear are often highly motivated |
Keep in mind — these patterns are generalizations. Sun Belt and coastal markets often move to different rhythms. Your local market data always beats national seasonality patterns.
Supply and Demand Dynamics
The July 2026 inventory level of 4.6 months of supply nationally is a real shift from the sub-2-month inventory that defined the pandemic seller's market. But it's still below the 5–6 months that signals a truly balanced market. What does that mean for you? Well-priced homes in desirable locations are still moving. Overpriced homes or homes needing work? They're sitting. Your neighborhood might look completely different from these national numbers — some metros have far more supply, others are still critically undersupplied. Always check your specific neighborhood's absorption rate, not just what you see nationally.
Interest Rates and Buyer Purchasing Power
With the 30-year fixed mortgage rate at 6.66% as of August 27, 2026, affordability is a real constraint on who can actually buy. Every 1% increase in rates reduces the amount a buyer can borrow — same monthly payment — by roughly 10%. This shapes your pricing directly because it determines who can actually afford your home. A seller holding out for a price that made sense at 3% rates is waiting for a buyer who probably doesn't exist in meaningful numbers right now. Fannie Mae's June 2026 forecast projects the 30-year rate at approximately 6.4% for the rest of 2026 — that's some modest relief, but not the dramatic drop that'd expand your buyer pool.
You should also understand the 2026 conforming loan limit of $832,750 for most of the U.S. (and $1,249,125 in high-cost areas). Homes below this limit get financed with conventional loans at standard rates and terms — a much, much larger buyer pool. Homes above it need jumbo financing, stricter qualification requirements, and a narrower universe of buyers. The difference between pricing at $840,000 versus $825,000? That can meaningfully affect how many buyers can comfortably finance the purchase.
Tax Implications That Influence Seller Behavior
Your tax position can also influence pricing decisions. Under current IRS rules, single filers can exclude up to $250,000 in capital gains from a home sale for the 2026 tax year, while married couples filing jointly may exclude up to $500,000 — provided you meet the two-year ownership and use requirements. If you've got significant appreciation, knowing where you stand relative to these thresholds shapes your net-proceeds calculation. Sometimes it even affects whether you've flexibility to negotiate price versus other terms. Get a tax professional involved for your specific situation.
Back to topAvoiding Common Pricing Mistakes
Emotional Attachment Leading to Overpricing
This is the single most common—and most costly—pricing error you can make. You've lived here for years. You painted those walls with care, planted those garden beds, finished that basement for the kids. Those experiences matter. They have real meaning to you.
But here's the thing: they don't transfer to a buyer. A new owner doesn't care about your memories. They're comparing square footage, condition, and price against competing homes. That's it. The market isn't sentimental, and your pricing can't be either.
Try this before you even look at comparables. Write down what you think your home is worth—don't overthink it, just your gut number. Now do your comp analysis and see where the actual market data lands. Is there a gap? There probably is.
Spend real time with that gap. Ask yourself honestly why it exists. In most cases, emotional inflation explains it. Not some hidden market premium your research missed.
Ignoring Property Condition Issues
You already know this from the condition section, but it's worth repeating: pricing over a problem never works. Buyers will spot the issue during a showing. Or their inspector will find it. Or their agent will point it out.
The longer you try to hide something, the worse it gets.
Back to top
